HiChIP Comparative Analyses
Introduction
Biological questions are seldom answered by analysing single samples in isolation. It is often the case that an experiment aims to make comparisons between two (or more) biological conditions, such as:
Untreated wild type vs treatment
Wild type vs knockout
Normal sample vs tumor
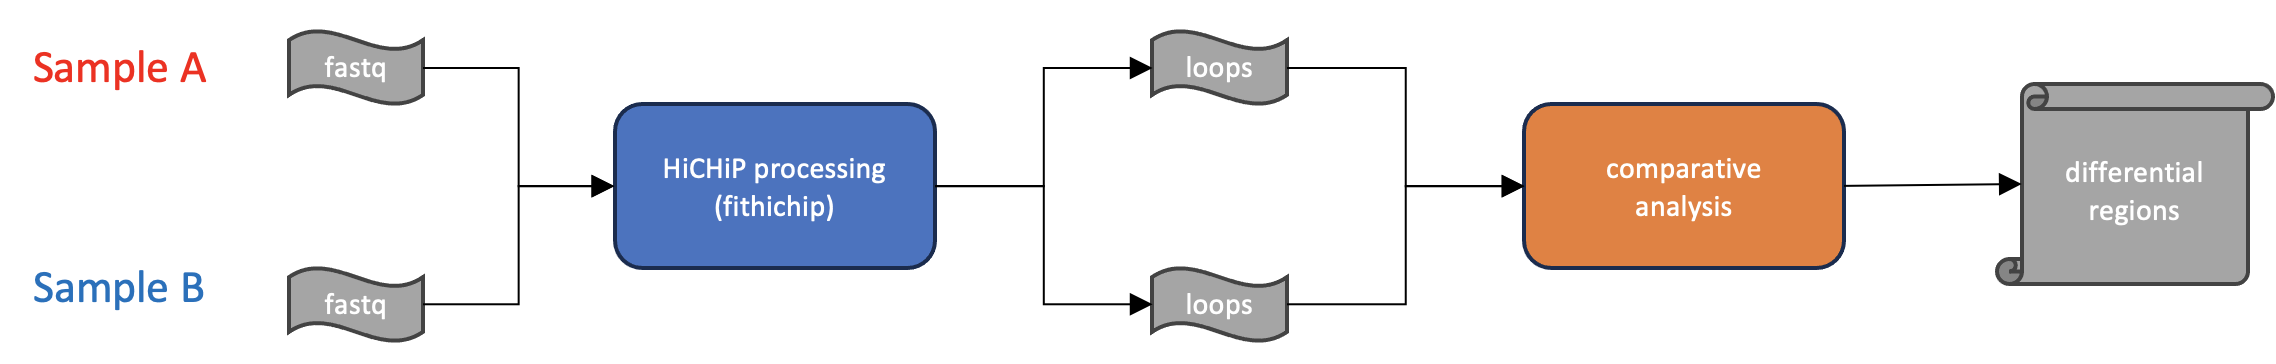
In all cases the goal is to produce a list of differentially interacting regions in one condition relative to the other. The main output for comparitive analses is analogous to what is expeected for differential gene expression, where the primary result is a table of regions, the fold change between conditions, and a statistical measure of signficance. For HiCHiP, the unit for comparison are the loop calls identified using the FitHiChIP software as described in previous steps.
Figure 1:
Differential Analysis
Question: How do I perform differential analyses for HiChIP?
Process: Results files from FitHiChIP are used to construct a differential design, and comparison is performed using the scripts bundled with fithichip software.
Results: Final results consist of a table of differentially interacting regions, fold change, and measure of statistical signficance.
- Files and tools needed:
FitHiChIP loop calls for each condition: PREFIX.interactions_FitHiC.bed
FitHiChIP differential analysis software and scripts
Associated ChIP-seq peak files [optional]
As the design of differential analysis experiments are unique to each biological question, there are multiple possibilites for how the analysis can be set up. A common scenario is to compare two conditions where each condition has two replicates, and is described in the FitHiChIP documentation pages.
Interpreting results:
FitHiChIP differential analysis produces a number of intermediate in addition to the final results table. The most important is the list of significant loops and is named “Loops_EdgeR_Default_SIG.bed”. In general, the interpretation of differential loop analysis is the same as what is familiar for gene expression analysis, where intereactions can be prioritized based on the fold change and statistical significance. An example output file is given below.
chr1 |
start1 |
end1 |
chr2 |
start2 |
end2 |
group1_R1_RawCC |
group1_R1_QVal |
group2_R1_RawCC |
group2_R1_QVal |
logFC |
logCPM |
PValue |
FDR |
group1_SigRepl |
group2_SigRepl |
|---|---|---|---|---|---|---|---|---|---|---|---|---|---|---|---|
chr1 |
930000 |
940000 |
chr1 |
940000 |
950000 |
0 |
1 |
37 |
0.8722 |
8.2960 |
5.4070 |
0.0000 |
0.0022 |
0 |
0 |
chr1 |
940000 |
950000 |
chr1 |
950000 |
960000 |
0 |
1 |
40 |
0.9991 |
8.4081 |
5.5105 |
0.0000 |
0.0016 |
0 |
0 |
chr1 |
1020000 |
1030000 |
chr1 |
1030000 |
1040000 |
0 |
1 |
43 |
1 |
8.5122 |
5.6071 |
0.0000 |
0.0012 |
0 |
0 |
chr1 |
1030000 |
1040000 |
chr1 |
1040000 |
1050000 |
0 |
1 |
55 |
0.872 |
8.8664 |
5.9403 |
0.0000 |
0.0004 |
0 |
0 |
chr1 |
1060000 |
1070000 |
chr1 |
1070000 |
1080000 |
0 |
1 |
48 |
0.9865 |
8.6705 |
5.7550 |
0.0000 |
0.0007 |
0 |
0 |
chr1 |
1070000 |
1080000 |
chr1 |
1080000 |
1090000 |
0 |
1 |
25 |
0.8722 |
7.7326 |
4.8990 |
0.0003 |
0.0127 |
0 |
0 |
chr1 |
1140000 |
1150000 |
chr1 |
1150000 |
1160000 |
0 |
1 |
30 |
0.9681 |
7.9945 |
5.1326 |
0.0001 |
0.0052 |
0 |
0 |
chr1 |
1150000 |
1160000 |
chr1 |
1160000 |
1170000 |
0 |
1 |
40 |
0.9984 |
8.4081 |
5.5105 |
0.0000 |
0.0016 |
0 |
0 |
chr1 |
1250000 |
1260000 |
chr1 |
1260000 |
1270000 |
28 |
0.8747 |
0 |
1 |
-7.7365 |
4.9817 |
0.0002 |
0.0109 |
0 |
0 |
- The most relevant fields from the output will be:
logFC – the log fold change in coverage between the two conditions
FDR – a p-value, after correction for multiple hypothesis testing, on the statistical signficance of the observed fold change
Considerations:
Replication – It is generally advisable to have technical replicates for differential analyses, as this will produce more statistically robust results. FitHiChIP is still able to perform differential analysis with single-replicate samples, and in this case reverts to the square-root-dispersion method used by EdgeR.
Paired ChIP-seq experiments – As mentioned above, it is best practices to have paired ChIP-seq experiments. If that is not do-able, FitHiChIP is bundled with a script that can call peaks de novo from the HiChIP data directly.