Library QC
Proximity-ligation assessment
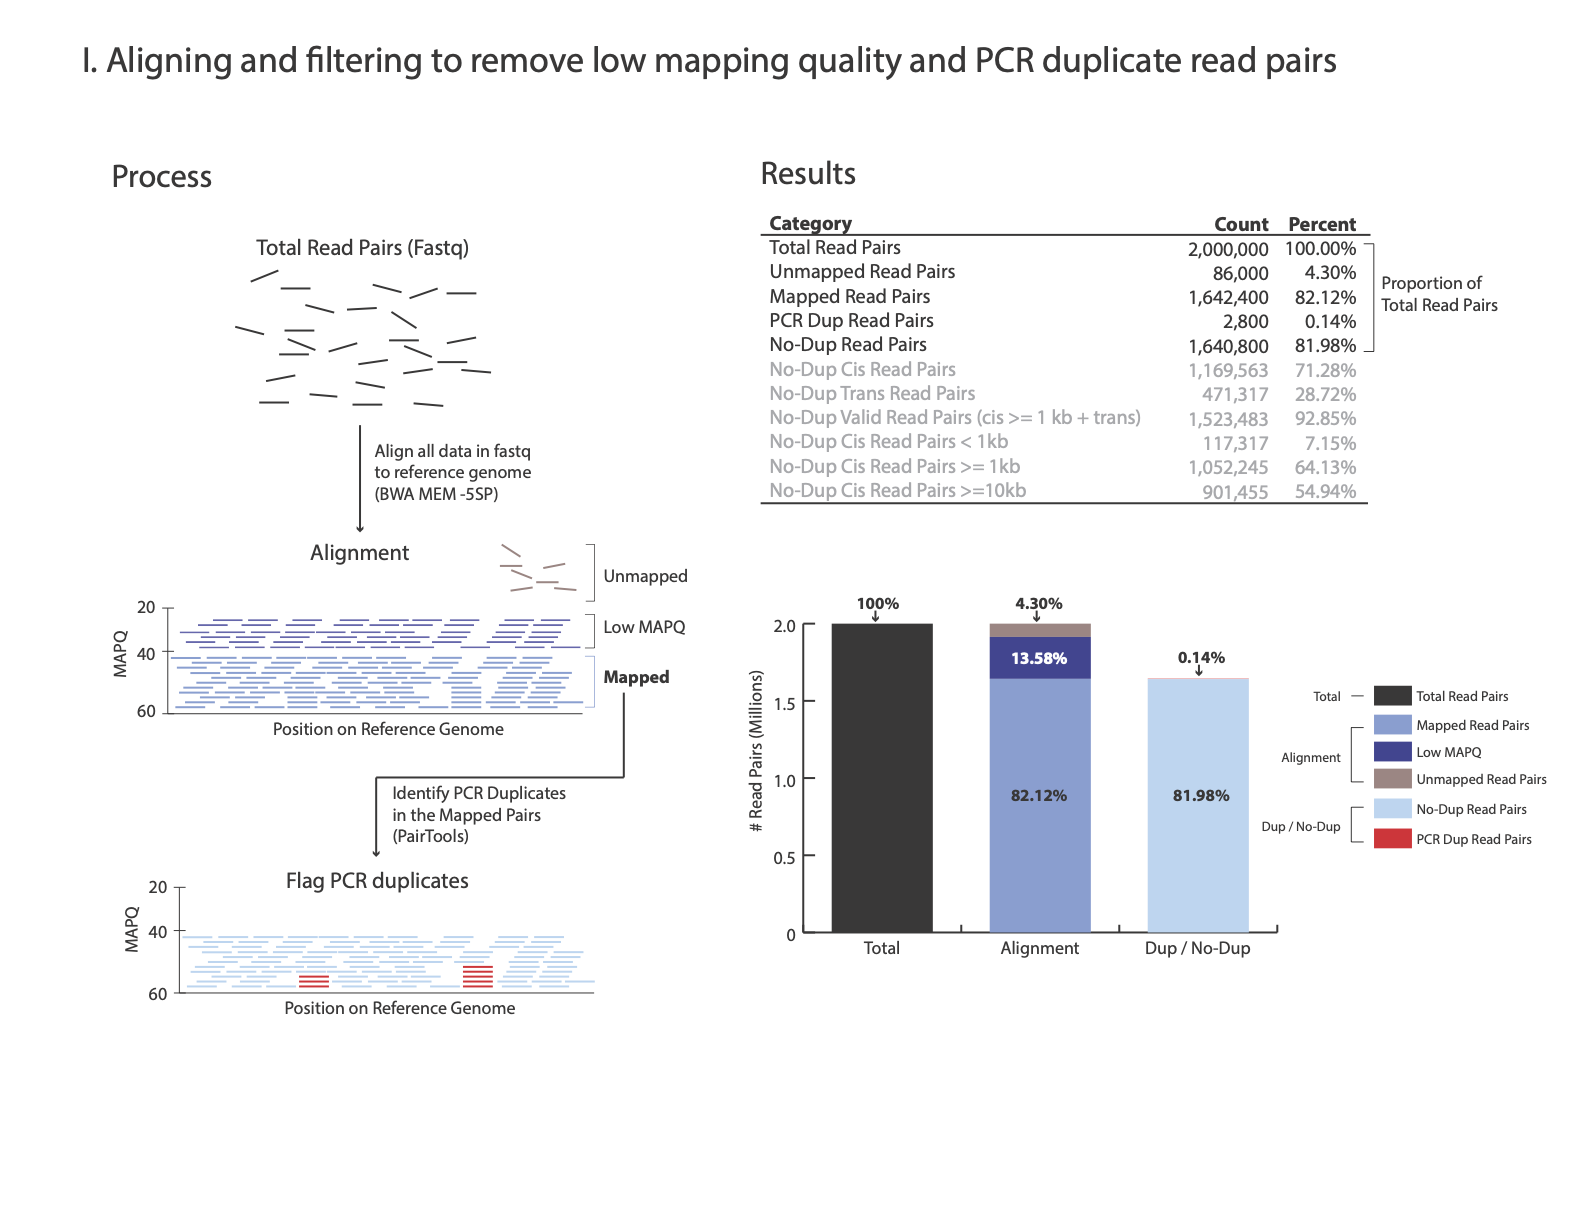
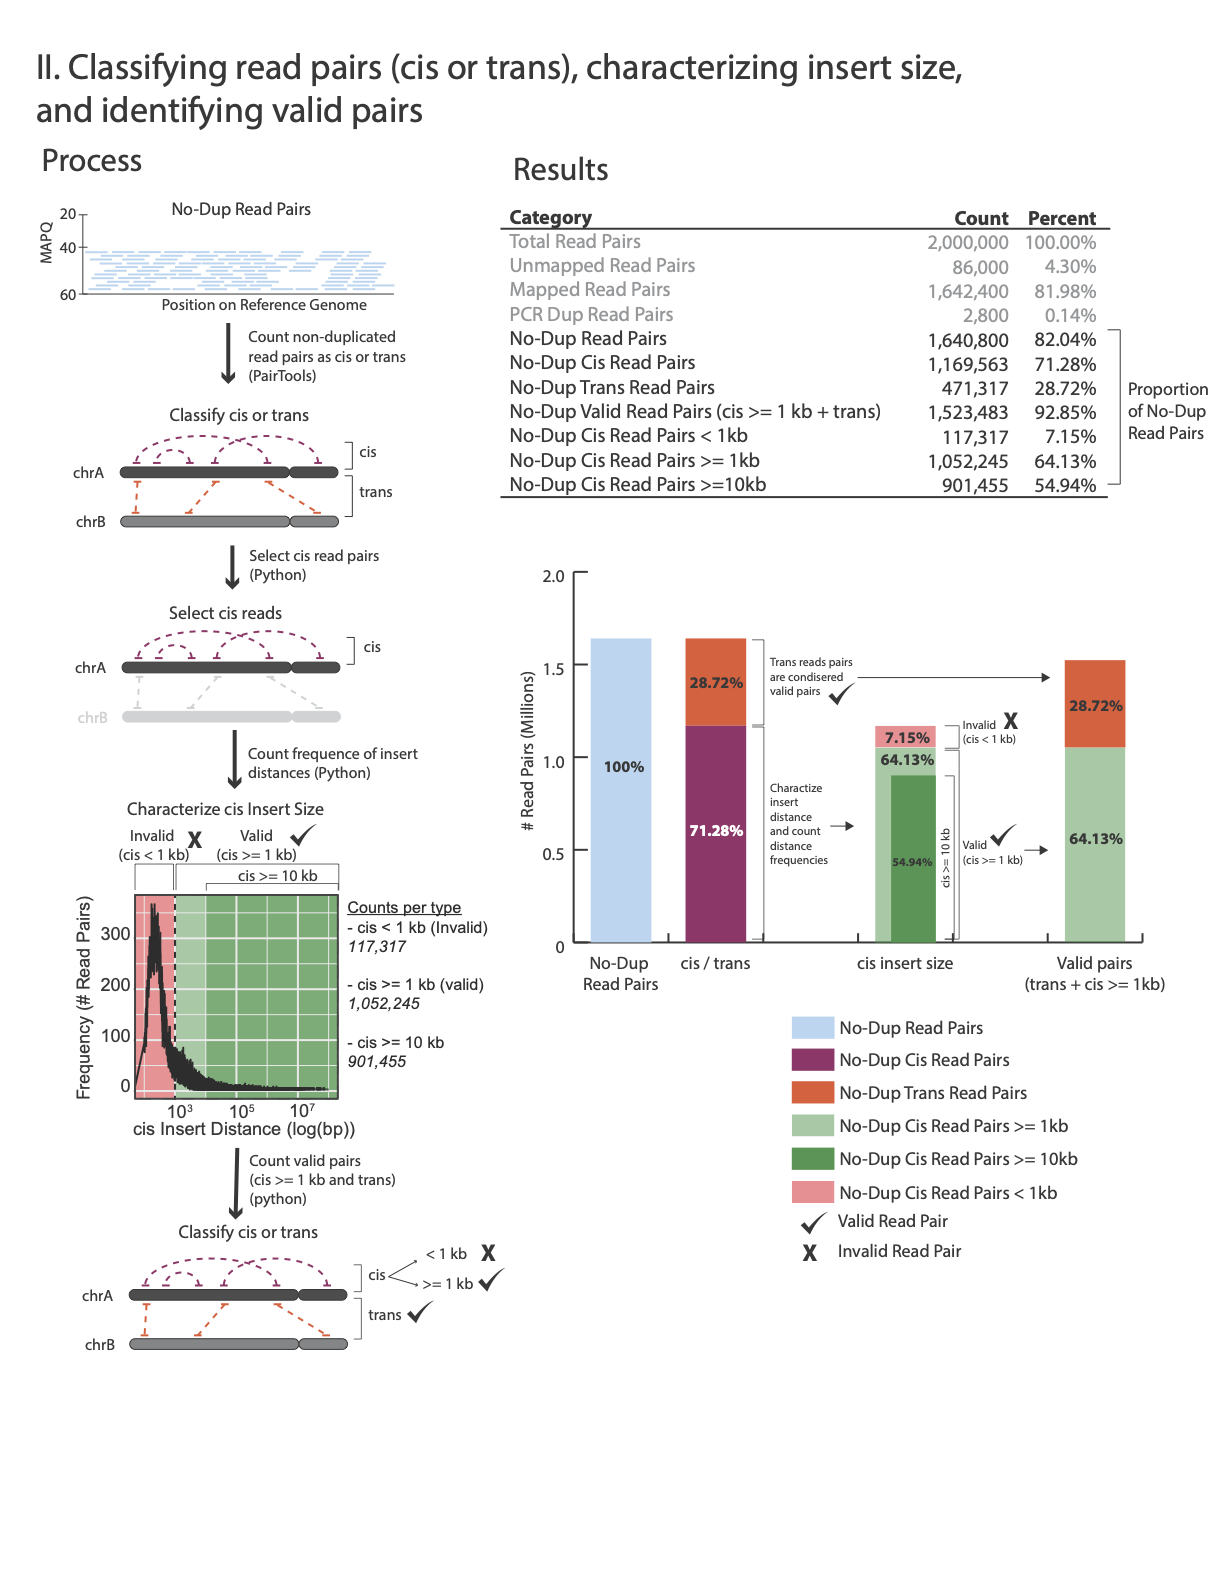
At step Removing PCR duplicates you used the flag –output-stats, generating a stats file in addition to the pairsam output (e.g. –output-stats stats.txt). The stats file is an extensive output of pairs statistics as calculated by pairtools, including total reads, total mapped, total dups, total pairs for each pair of chromosomes etc’. Although you can use directly the pairtools stats file as is to get informed on the quality of the HiChIP library, we find it easier to focus on a few key metrics. We include in this repository the script get_qc.py that summarize the paired-tools stats file and present them in percentage values in addition to absolute values.
The images below explains how the values on the QC report are calculated:
Command:
python3 ./HiChiP/get_qc.py -p <stats.txt>
Example:
python3 ./HiChiP/get_qc.py -p stats.txt
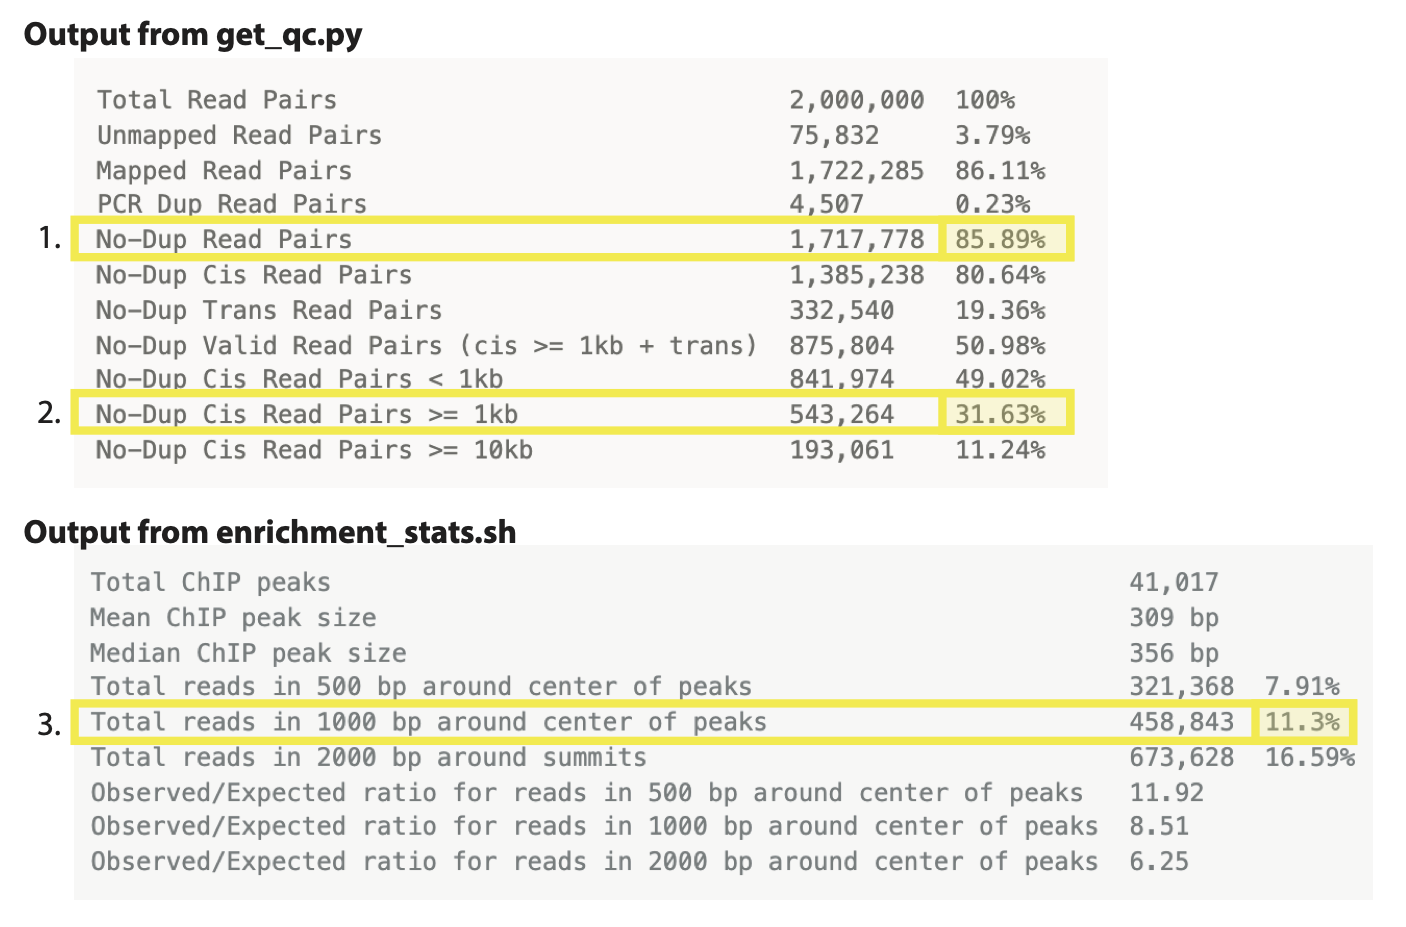
After the script completes, it will print:
Total Read Pairs                              2,000,000  100%
Unmapped Read Pairs                           75,832     3.79%
Mapped Read Pairs                             1,722,285  86.11%
PCR Dup Read Pairs                            4,507      0.23%
No-Dup Read Pairs                             1,717,778  85.89%
No-Dup Cis Read Pairs                         1,385,238  80.64%
No-Dup Trans Read Pairs                       332,540    19.36%
No-Dup Valid Read Pairs (cis >= 1kb + trans)  875,804    50.98%
No-Dup Cis Read Pairs < 1kb                   841,974    49.02%
No-Dup Cis Read Pairs >= 1kb                  543,264    31.63%
No-Dup Cis Read Pairs >= 10kb                 193,061    11.24%
We consider a library prepared from a mammalian sample to be acceptable if: - Mapped nondupe pairs cis > 1,000 bp is greater than 20% of the total mapped No-Dup pairs.
ChiP enrichment
Calculating enrichment stats
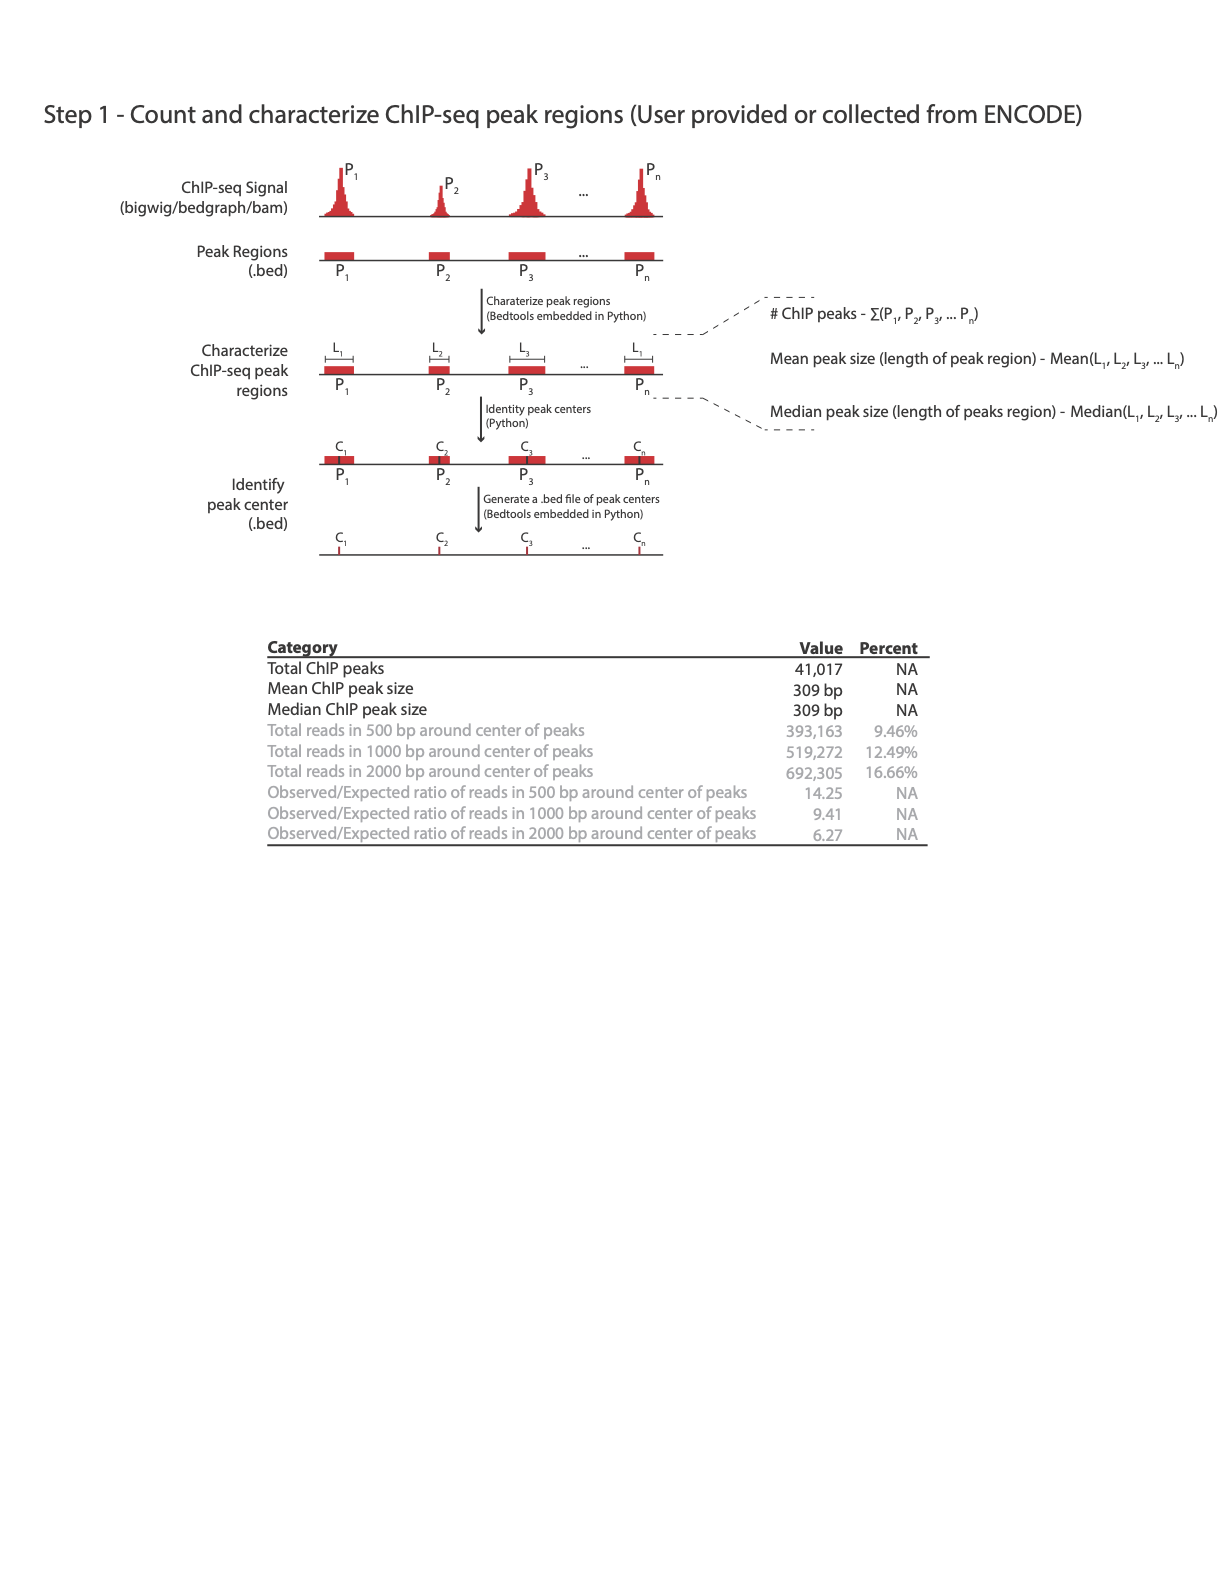
Another key step in evaluating the quality of the HiChiP library is assessing the enrichment of HiChIP reads at protein binding sites, when protein binding sites correspond to a list of ChiP-Seq peaks.
Our QC pipeline supports as an input both peaks in a simple bed file format (containing three columns: chr, star, end) or ENCODE narrow peak format. For your convenience we include here links to some key examples of peak files from ENCODE ChiP-Seq experiments. All are of proteins for which Dovetail™ HiChIP MNase Kit has validated antibodies.
You can obtain gold-standards Chip-Seq peaks from databases, such as ENCODE, or generate your own list of peaks based on ChiP-Seq experiments, e.g. using MACS2.
To calculate stats of reads enrichment around ChIP peaks, we provide the enrichment_stats.sh script:
Reminder!
Did you remember to make the enrichment_stats.sh script executable?
If not, run the following command:
chmod +x ./HiChiP/enrichment_stats.sh
If you already ran this command, no need to run it again the execution permission is saved
Parameter |
Function |
|---|---|
-g |
Input genome file |
-b |
Input final bam file |
-p |
Input (either in asimple bed format or narrow peak format) |
-t |
no. of threads |
-x |
Prefix for output file, enrichment stats will be saved to <prefix>_hichip_qc_metrics.txt |
Command:
./HiChiP/enrichment_stats.sh -g <ref.genome> -b <mapped.PT.bam> -p <peaks.bed> -t <cores> -x <prefix>
Example:
./HiChiP/enrichment_stats.sh -g hg38.genome -b mapped.PT.bam -p ENCFF017XLW.bed -t 16 -x CTCF
Tip!
If your peak file is zipped make sure to unzip it before running the enrichment_stats.sh script, e.g.:
gunzip peak.bed.gz
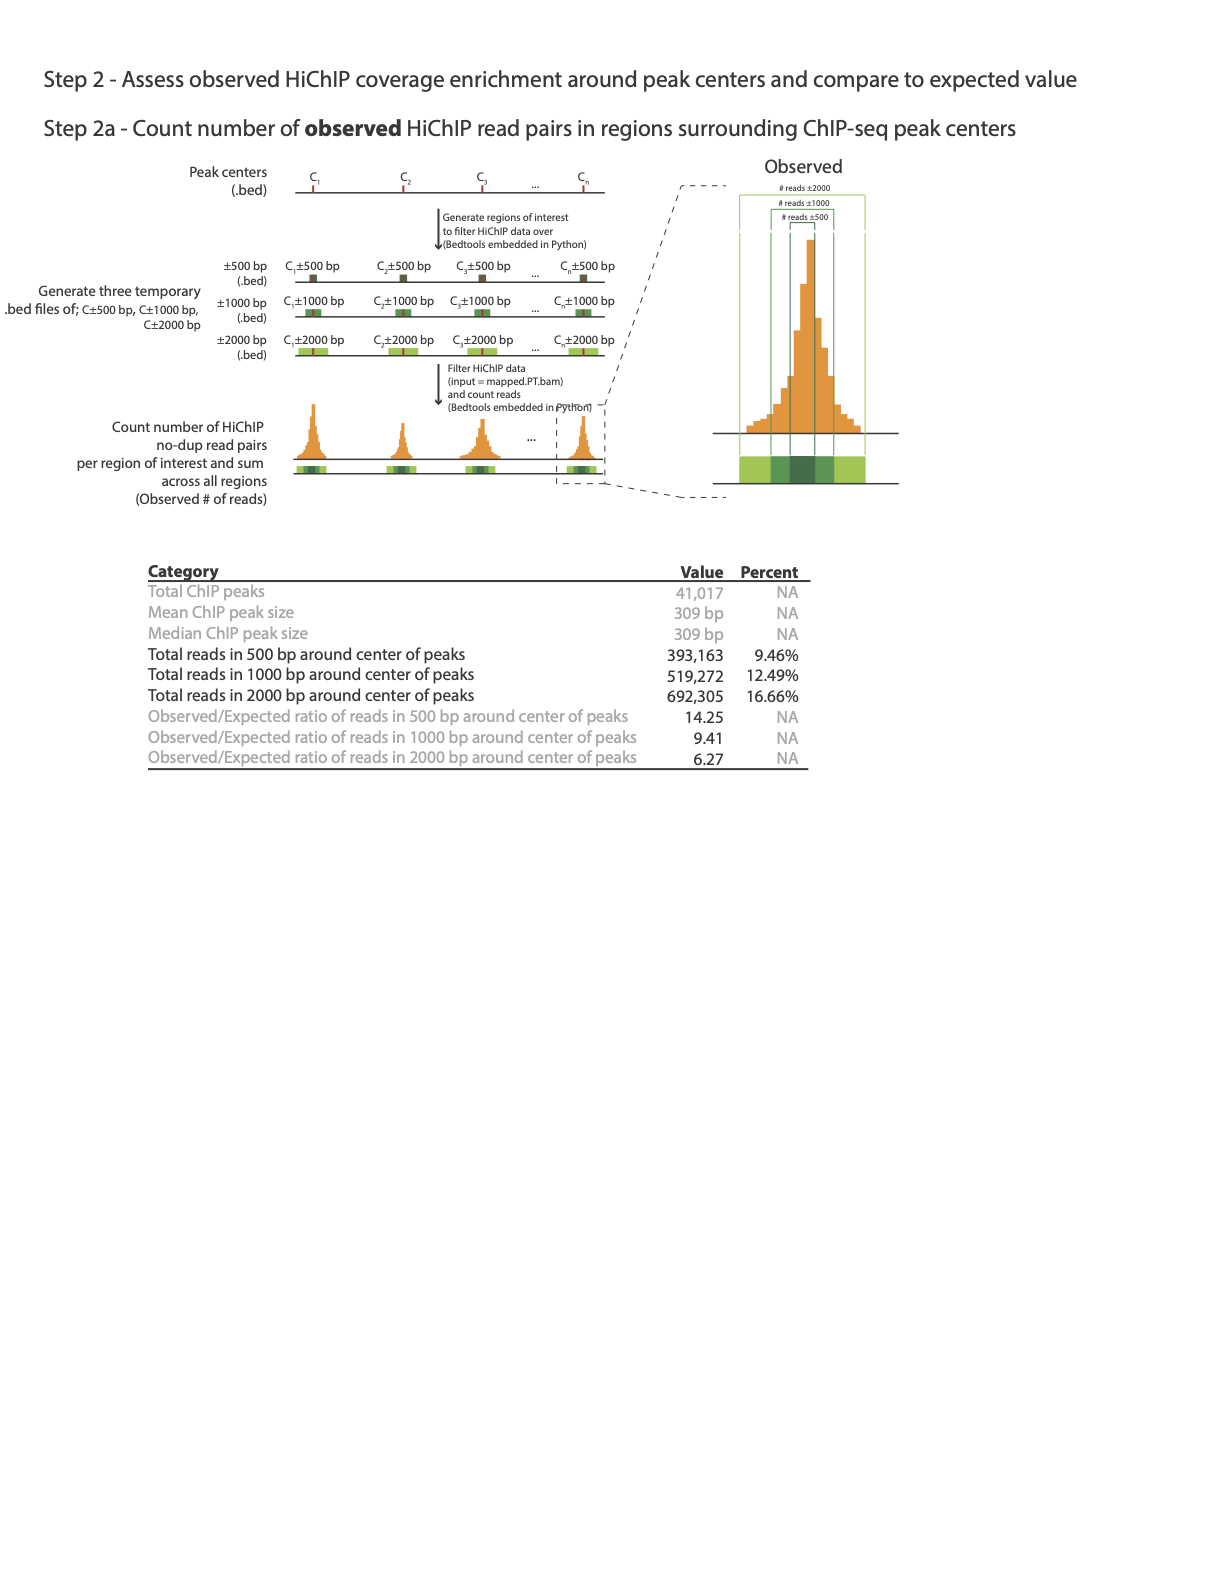
In this example an output file CTCF_hichip_qc_metrics.txt will be created with the below information:
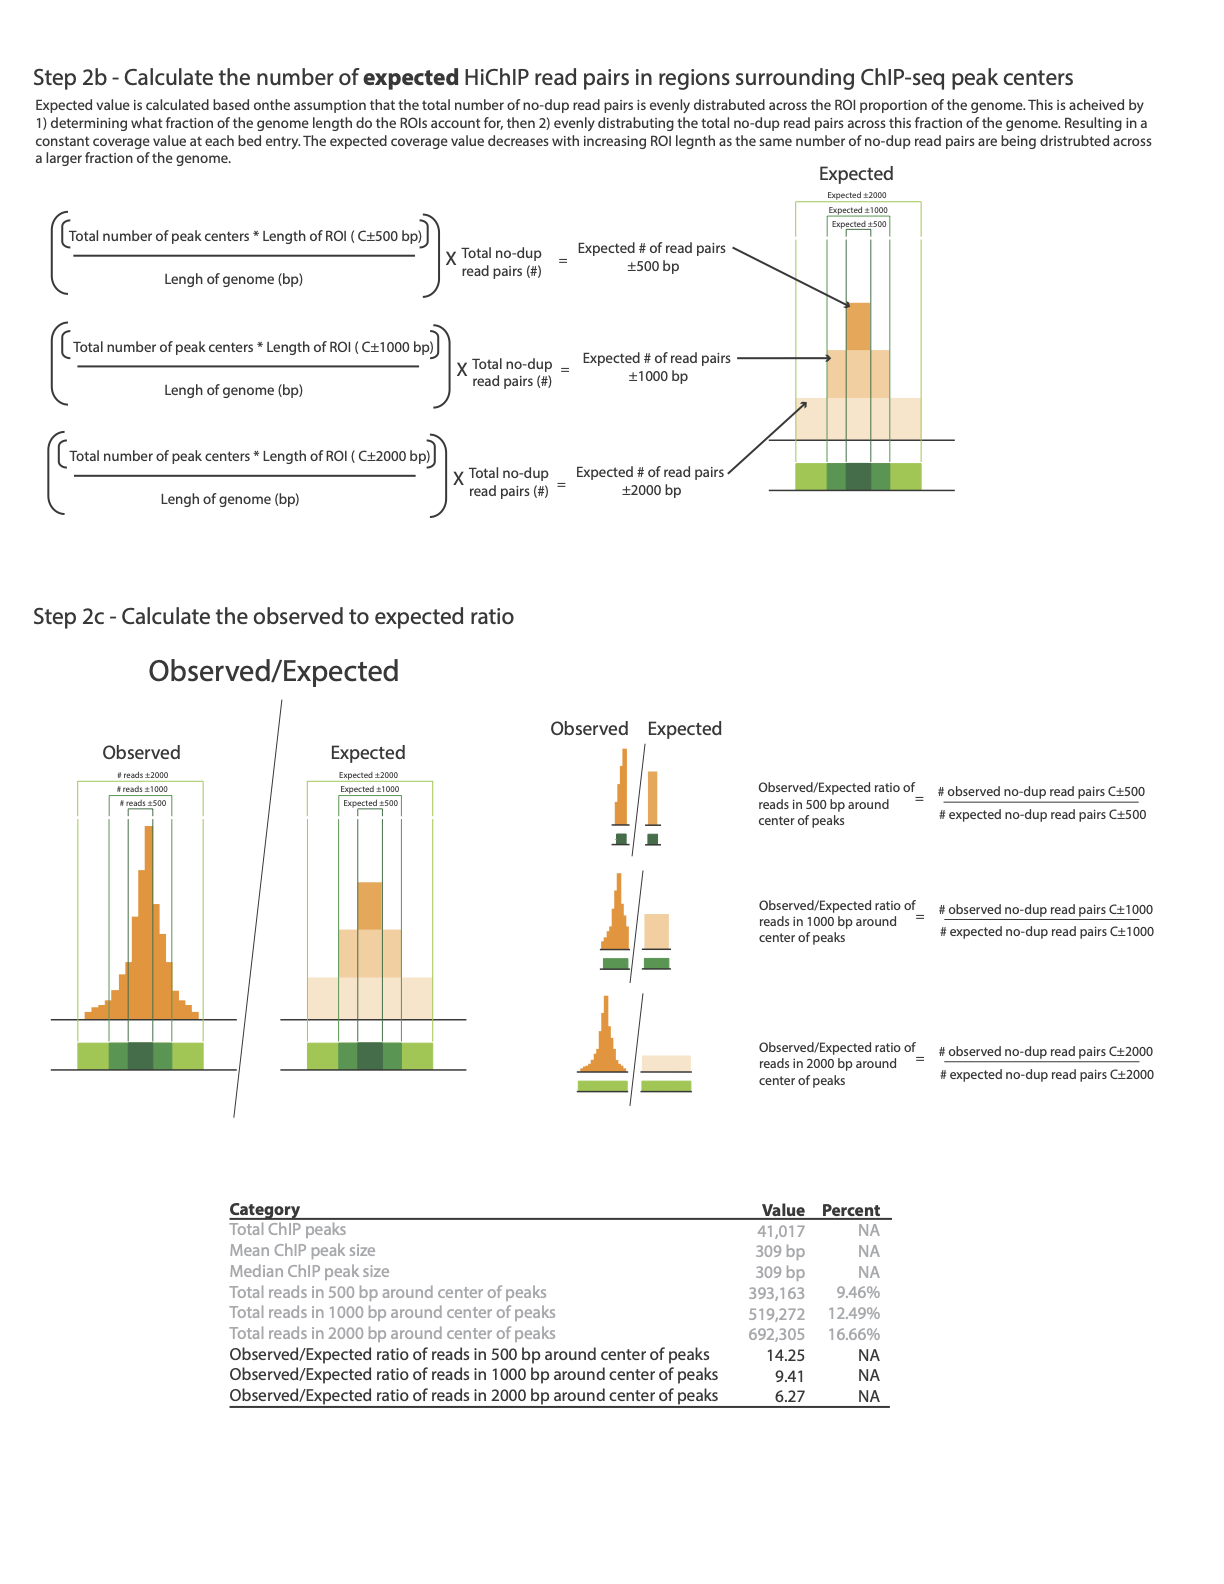
Total ChIP peaks                                                     41,017
Mean ChIP peak size                                                  309 bp
Median ChIP peak size                                                356 bp
Total reads in 500 bp around center of peaks                         321,368  7.91%
Total reads in 1000 bp around center of peaks                        458,843  11.3%
Total reads in 2000 bp around summits                                673,628  16.59%
Observed/Expected ratio for reads in 500 bp around center of peaks   11.92
Observed/Expected ratio for reads in 1000 bp around center of peaks  8.51
Observed/Expected ratio for reads in 2000 bp around center of peaks  6.25
The following image illustrates how enrichment around ChiP-Seq peaks is calculated:
Plotting global enrichment around ChiP peaks
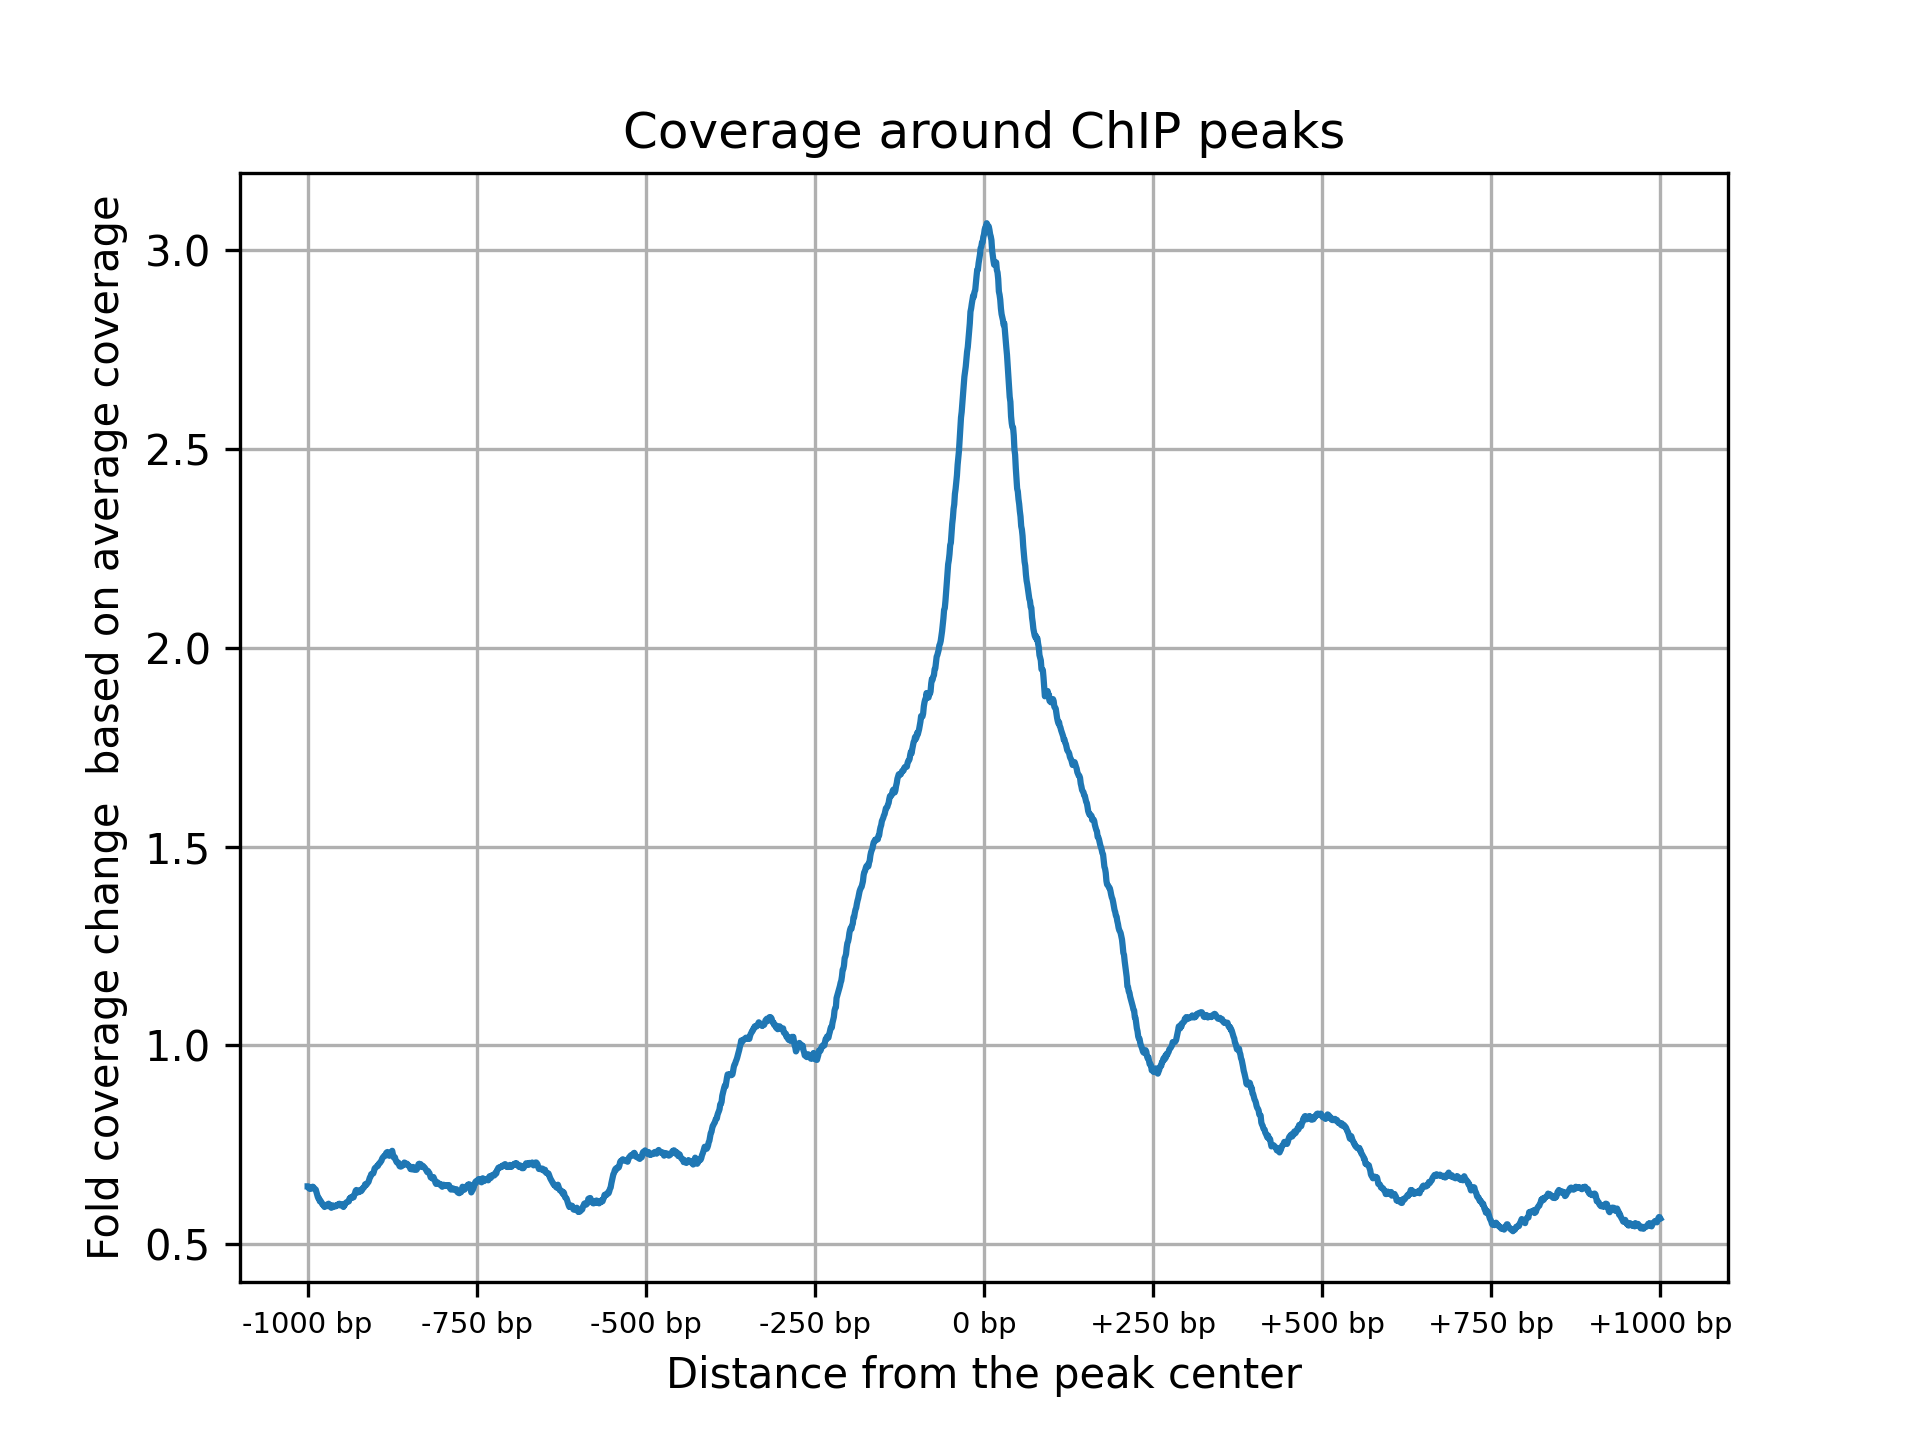
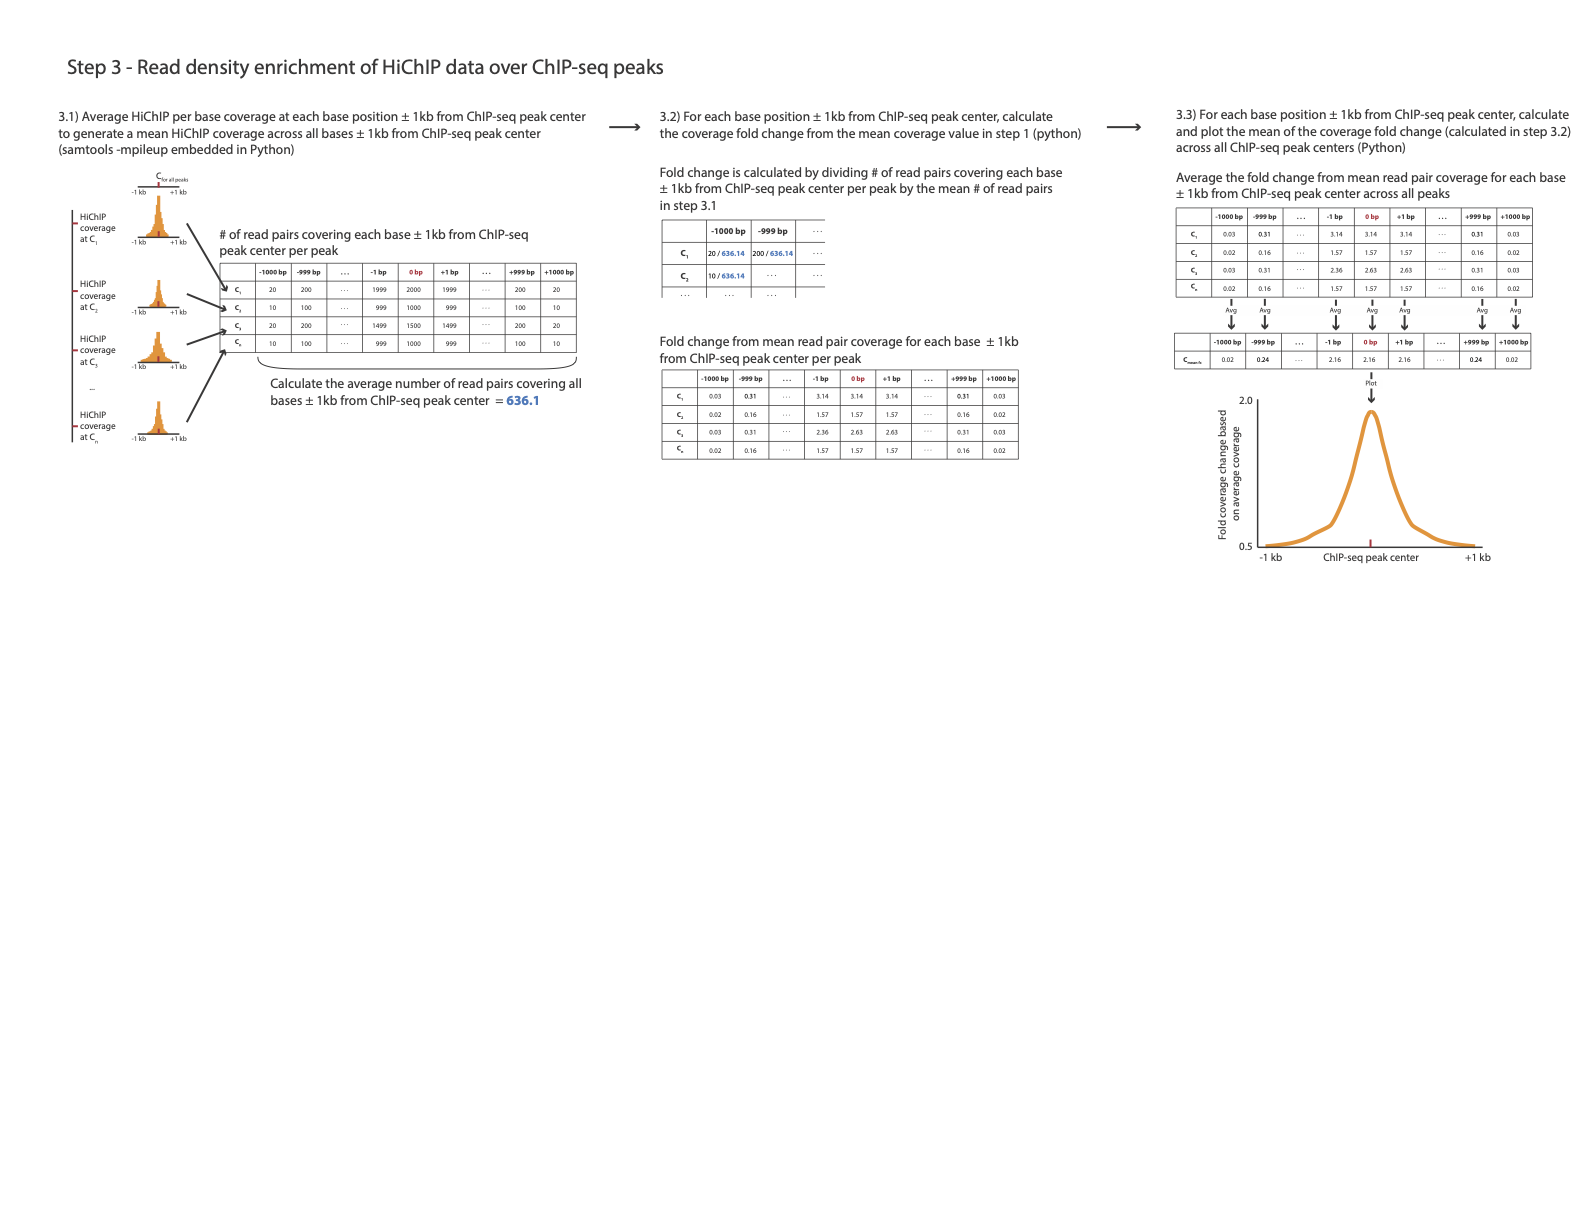
The plot_chip_enrichment.py and plot_chip_enrichment_bed.py scripts provide global evaluation of enrichment around known ChiP peaks. The script identifies the regions of ChiP peaks, sets a window of 1kb upstream and downstream of the peak’s center, and based on the bam file of the valid pairs, calculates the aggregated read coverage within this window and plots the global fold coverage change based on the observed coverage divided by the mean coverage, as illustrated.
plot_chip_enrichment.py is intendent to be used when a narrowPeak file is available and plot_chip_enrichment_bed.py accept a simple bed file with peaks intervals as an input. Other than that, the two scripts accept the same parameters:
Parameter |
Function |
|---|---|
-bam |
Input final bam file |
-peaks |
Input peaks in |
-output |
ouptput file name to save the enrichment plot .png image |
Command:
python3 plot_chip_enrichment.py -bam <mapped.PT.bam> -peaks <peaks.bed> -output <enrichment.png>
or
python3 plot_chip_enrichment_bed.py -bam <mapped.PT.bam> -peaks <peaks.bed> -output <enrichment.png>
Example:
python3 ./HiChiP/plot_chip_enrichment.py -bam mapped.PT.bam -peaks ENCFF017XLW.bed -output enrichment.png
or
python3 ./HiChiP/plot_chip_enrichment_bed.py -bam mapped.PT.bam -peaks peaks.bed -output enrichment.png
Output plot:
Important!
plot_chip_enrichment.pywill accept onlynarrowPeakformat which has to include 10 columns, with the following specifications: - chromosome, start, end, in the three first columns - Peak Signal value at column #7 - Peak offset value at column #10 (when offset is the distance between the start position and the center of the peaks)If your peak file does not follow the above structure you can modify it into a simple bed file by extracting only the three first columns into a new file that can be used with the plot_chip_enrichment_bed.py script.
plot_chip_enrichment_bed.pywill accept only bed files with 3 columns. If your bed file includes more than three columns, extract the three first columns into a new fileExample, how to extract only the first three columns:
cut -f1,2,3 input.bed > output.bed
There are two minor differences between the two scripts:
plot_chip_enrichment.pycalculates the center of the peak according tostart + offsetplot_chip_enrichment_bed.pychooses the center of the peak as the middle point betweenstartandend. Both will calculate the aggregated enrichment -1kb and +1kb of the center of the peak (no matter the legnth of the peak)All intervals in the bed files are used for the meta-analysis when
plot_chip_enrichment_bed.pyis usednarrowPeakformat includes information on peak signal, this information is used to filter out peaks with extreme values (either very low or very high signals) prior to meta-analysis
QC Assessment
Pass/No Pass Metrics
Now that you have successfully completed the QC scripts, it is time to determine if the HiChIP library is of high quality. The QC metrics calculated above can be distilled down to three key quantitative metrics and one qualitative step to help you assess the quality of the library before proceeding into deep sequencing.
No-Dup Read Pairs – This value is reflective of the alignment rate and PCR duplication rate. It should be noted that this value scales inversely with sequencing depth.
No-dup cis read pairs ≥ 1kb – This value demonstrates that the proximity-ligation step was successful, and the majority of the data are useful in downstream analyses (e.g. loop calling). This value can be dependent on the protein of interest, for example CTCF has a very long-range contact profile while POL2A has a much more localized contact domain. The cut-off used here is applicable across different protein targets.
Total reads in 1000 bp around center of peaks – This value demonstrates that chromatin enrichment was successful. This metric is very similar to Fraction of Reads in Peaks (FRiP) score that is used to assess ChIP-seq data as defined by ENCODE. Our defined cut-off value is slightly more stringent than the ENCODE standard of 1%. It should be noted that this value is dependent on the peak set used, the value can be underestimated if you used a peak set that is not reflective of your experiment (e.g publicly available).
Visual assessment of HiChIP coverage in IGV – This step provides you a visual peace of mind that your IP-enrichment was successful. Alignments (.bam) should be converted into bigwig format with deepTools bamCoverage https://deeptools.readthedocs.io/en/develop/content/tools/bamCoverage.html).
While the QC process can be boiled down to these key values, the remaining values of the QC process are used to diagnose and troubleshoot a library that falls into the “No Pass” category. Therefore, it is important to generate all the values in the QC process in case there is a need for troubleshooting.
Pass/No Pass Values
The table below summarizes the minimum passing values for the metrics defined above. The cut-off values were determined for both shallow sequenced (20 million read pairs 2 x 150 bp) and deep sequenced data (100-200 Million read pairs 2 x 150 bp), as the percentage of mapped no-dup pairs changes with the sequencing depth.
Metric |
Shallow Seq (20M) |
Deep Seq (100-200M) |
|---|---|---|
No-Dup Read Pairs |
>75% |
>50% |
No-dup cis read pairs ≥ 1kb |
>20% |
>20% |
Total reads in 1000 bp around center of peaks |
>2% |
>2% |
Visual Inspection Of The Alignments
Once you have compared your library QC values to the minimal quantitative requirements for a library to pass QC, you can move on visual assessment in IGV. Here we used the Integrated Genome Viewer (which can be downloaded an installed here). IGV is standard genome browser for visualizing NGS data in track format. Simply load your bigwigs into IGV then zoom in to a 1-2 Mbp window. In this step, we are looking to see if the data suggest that there has been enrichment.
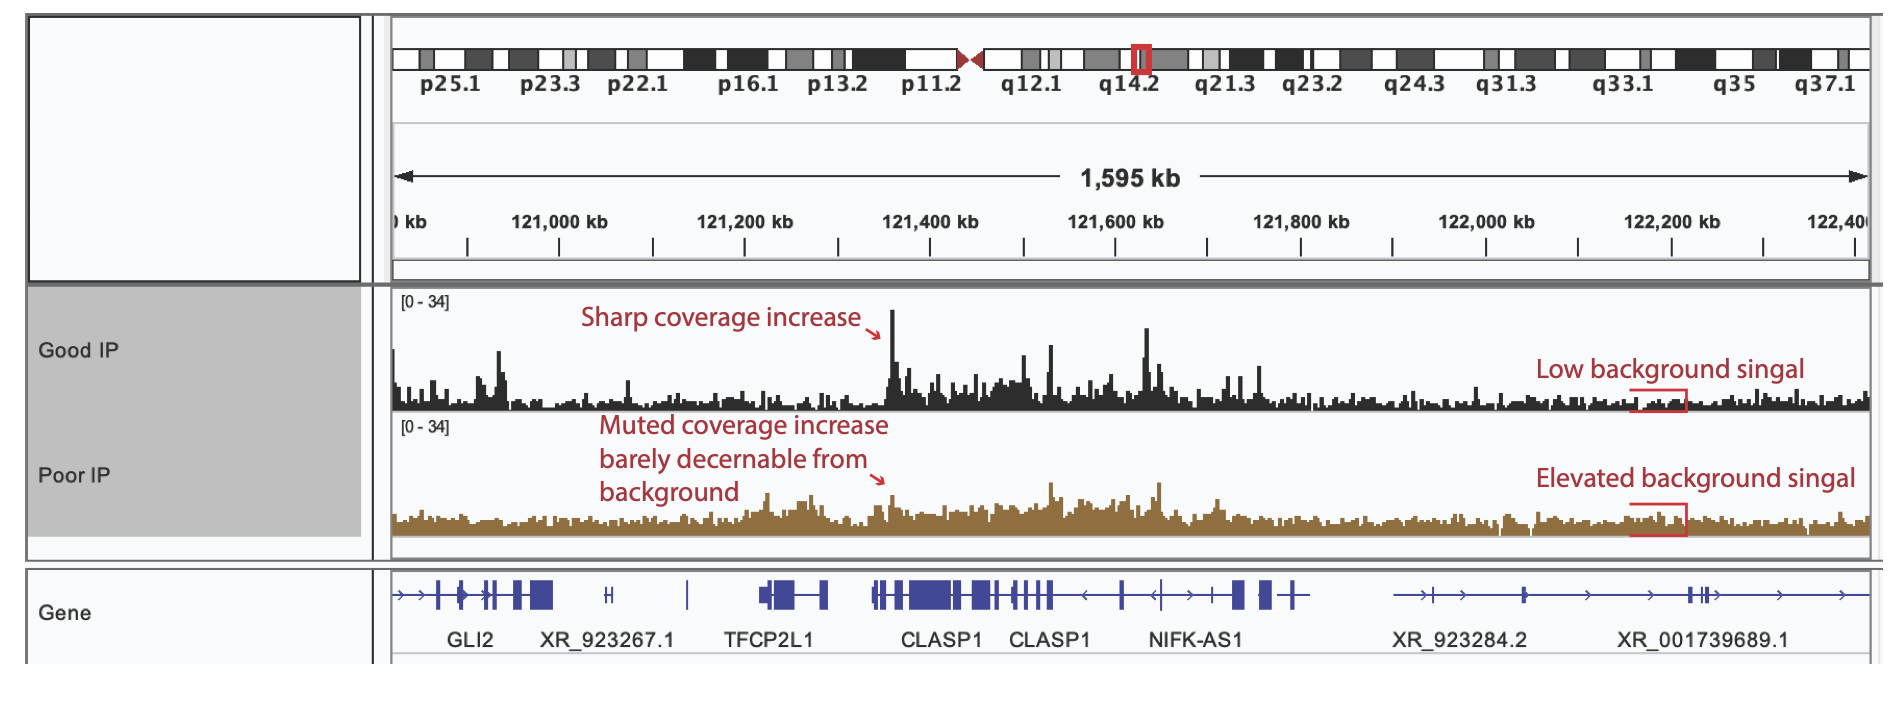
Good IP – exhibit distinct signals of sharply increased coverage from a low background indicating the location of the protein-DNA binding Site.
Poor IP – exhibit no or weak coverage increases and are often accompanied by an elevated background signal.
Below is an annotated screenshot from IGV showing examples of both good and bad IP of shallow sequenced (20 M read pairs) libraries. The library exhibiting good IP characteristics (top track in black) shows clear, sharp coverage enrichment, and low background signal, where the library with poor IP, (bottom track in brown) has a high background signal and muted coverage enrichment.
Final Determination
If your libraries pass the minimum threshold for each of the 3 quantitative metrics, and the visual inspection:
For shallow sequenced libraries - proceed to deep sequencing (~150 M read pairs per library)
For deep sequencing – proceed with downstream analyses
If the libraries fail one or more of the 3 quantitative metrics or the visual inspection - please reach out to our support team at: support@dovetail-genomics.com